Inside the Black Box: Who Actually Uses U.S. Data Centers, and How Much Power Does Each Use Case Consume?
Abstract
Data centers are routinely described as the infrastructure backbone of the digital economy, but that framing obscures more than it reveals. This paper disaggregates the U.S. data center market by facility type and workload category — cloud computing, artificial intelligence, traditional enterprise functions, content delivery and streaming, and storage — and examines what each use case actually contributes to total power consumption. The picture that emerges is one of a market in rapid structural transition: AI workloads are consuming an outsized and accelerating share of data center electricity relative to their current footprint, and that imbalance will define grid planning, infrastructure investment, and land use policy for the remainder of the decade.
Executive Summary
There are more than 5,000 data centers operating in the United States today, and together they consumed 183 terawatt-hours of electricity in 2024 — more than 4 percent of all U.S. electricity generation, roughly equivalent to the annual energy demand of Pakistan. But the headline number conceals a more important story: not all data center power is created equal, and the mix of workloads driving that consumption is shifting faster than grid planners, utility regulators, or most policymakers currently appreciate.
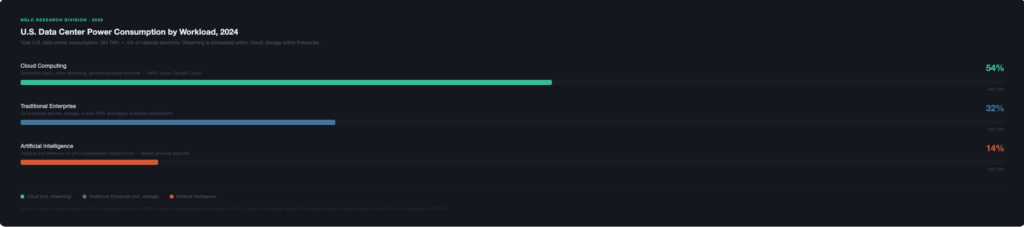
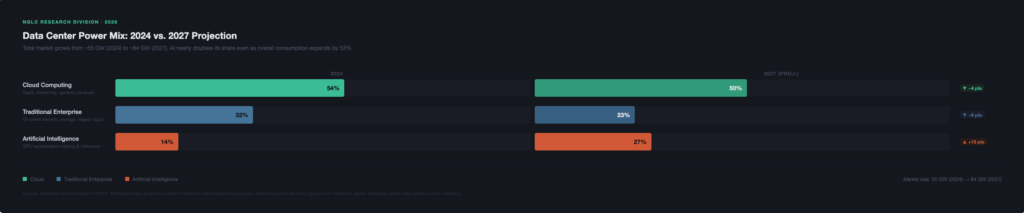
The U.S. data center market currently divides into three broad workload categories by power share: cloud computing — which encompasses everything from enterprise software to video streaming to e-mail — accounts for approximately 54 percent of total power draw. Traditional on-premises enterprise workloads, including basic storage, internal databases, and legacy business applications, account for roughly 32 percent. Artificial intelligence, despite dominating headlines and capital expenditure announcements, currently represents approximately 14 percent of total data center power consumption. That figure is changing rapidly. By 2027, AI is projected to nearly double its share to 27 percent — not because cloud and enterprise workloads are shrinking in absolute terms, but because AI’s per-task energy intensity is orders of magnitude higher than any workload category that preceded it.
Understanding this breakdown matters beyond abstract energy accounting. The infrastructure required to serve a hyperscale AI training cluster is categorically different from the infrastructure required to serve a content delivery network or a corporate file server — in scale, in constancy of load, in cooling requirements, and in the grid connection specifications that determine where these facilities can be built. For municipalities, utility planners, and land developers, the workload behind a data center proposal is not a technical detail. It is the central fact that determines the facility’s power demand profile, its infrastructure footprint, and its long-term impact on the surrounding grid.
Table of Contents
Section 1: The U.S. Data Center Landscape — Scale, Count, and Concentration
Section 2: Facility Types — Understanding the Physical Infrastructure
— 2.1 Enterprise Data Centers
— 2.2 Colocation Data Centers
— 2.3 Hyperscale Data Centers
— 2.4 Edge Data Centers
— 2.5 Dedicated AI Data Centers
Section 3: Workload Categories and Their Power Consumption
— 3.1 Cloud Computing: The Dominant Load
— 3.2 Traditional Enterprise: The Shrinking Incumbent
— 3.3 Artificial Intelligence: The Disruptive Variable
— 3.4 Streaming and Content Delivery: Hidden Inside the Cloud
— 3.5 Storage: Stable, Distributed, and Underappreciated
Section 4: The AI Inflection — Why the Mix Is Shifting and What It Means for the Grid
Section 5: Power Consumption Inside a Data Center — Where the Electricity Actually Goes
Section 6: Why This Matters
Section 7: Key Takeaways
Sources
Section 1: The U.S. Data Center Landscape — Scale, Count, and Concentration
The National Telecommunications and Information Administration counted more than 5,000 data centers operating in the United States as of 2024. That figure, while large in absolute terms, significantly underrepresents the actual infrastructure footprint, because it counts facilities rather than capacity — and the facilities being built today are dramatically larger than those that dominated the market a decade ago. The shift from thousands of modest enterprise server rooms to a smaller number of warehouse-scale hyperscale campuses is one of the defining structural changes in the industry, and it has profound consequences for how power demand is concentrated geographically and on the grid.
Northern Virginia remains the most data center-dense market on Earth, with approximately 4,000 megawatts of operational capacity in the region as of 2024. But the market has expanded significantly beyond its historical centers. Phoenix, Atlanta, Dallas, Chicago, and the New Jersey–New York corridor have all seen rapid development, driven by a combination of available land, power infrastructure, fiber connectivity, and — critically — state and local tax incentive regimes designed to attract data center investment. As those incentive regimes face increasing political scrutiny in the context of rising electricity rates, the geography of new development is itself becoming a policy variable.
Total U.S. data center electricity consumption has grown at a compound annual rate of approximately 18 percent from 2018 to 2023, and that growth rate is projected to accelerate. The Lawrence Berkeley National Laboratory’s 2024 report, commissioned by the U.S. Department of Energy, projects U.S. data center power consumption reaching between 325 and 580 terawatt-hours annually by 2028 — representing between 6.7 and 12 percent of all U.S. electricity consumption. The variance in that range is itself informative: it reflects genuine uncertainty about how quickly AI workloads will scale, how aggressively efficiency improvements will offset raw demand growth, and how many of the interconnection requests currently in utility queues will actually result in operating facilities.
5,000+ U.S. data centers operating as of 2024 (NTIA) | 183 TWh U.S. data center electricity consumption in 2024 | 4% Share of total U.S. electricity consumed by data centers in 2024 | 18% Compound annual growth rate in U.S. data center electricity consumption, 2018–2023
Section 2: Facility Types — Understanding the Physical Infrastructure
Before disaggregating data center power consumption by workload, it is necessary to understand the facility types through which that consumption occurs. The popular image of a data center — a nondescript warehouse on the edge of an industrial park — is accurate for some facilities and wholly inadequate for others. The industry spans a spectrum from closet-sized edge nodes to campus-scale hyperscale complexes covering hundreds of acres, and each facility type has a distinct relationship to the workloads it serves and the power infrastructure it requires.
2.1 Enterprise Data Centers
Enterprise data centers are facilities built, owned, and operated by a single organization to serve its own internal computing needs. For most of the industry’s history, this was the dominant model: a corporation, government agency, hospital, or university would construct its own server room or dedicated facility to house its IT infrastructure. Enterprise data centers typically operate at lower efficiency levels than their hyperscale counterparts, with Power Usage Effectiveness ratios — the measure of how much total facility power is consumed per unit of useful computing power — ranging from 1.5 to 1.8, compared to 1.2 or below at leading hyperscale facilities. As of 2023, internal enterprise data centers accounted for roughly 26 percent of all servers, down sharply from the majority position they held in 2010.
2.2 Colocation Data Centers
Colocation facilities — often shortened to “colo” — are third-party-operated data centers that rent space, power, and physical infrastructure to multiple customers. A colocation customer owns its own servers and networking equipment but leases the building, power feed, and cooling systems from the facility operator. Colocation has grown significantly as organizations have sought to reduce capital expenditure on physical infrastructure while maintaining direct control over their hardware. Major colocation operators include Equinix, Digital Realty, and Iron Mountain.
2.3 Hyperscale Data Centers
Hyperscale data centers are warehouse-scale facilities operated by cloud service providers — primarily Amazon Web Services, Microsoft Azure, and Google Cloud — to serve millions of external customers simultaneously. These facilities are defined less by their physical size than by their architectural design: they are built for horizontal scaling, meaning they can expand capacity by adding standardized server units without fundamental redesign. Hyperscale facilities operate at the frontier of energy efficiency, with leading operators achieving Power Usage Effectiveness ratios below 1.2, but their sheer scale means they account for an enormous and growing share of total power demand. As of 2023, 74 percent of all servers now operate in colocation or hyperscale facilities — a complete reversal of the enterprise-dominated market of a decade ago.
2.4 Edge Data Centers
Edge data centers are smaller, geographically distributed facilities designed to bring computing resources physically closer to end users, reducing the latency associated with routing data to a distant hyperscale campus. Individual edge facilities are relatively modest in power draw, typically consuming between 50 kilowatts and 2 megawatts. Their significance lies in their aggregate number and geographic distribution — thousands are being deployed globally, often in urban areas where grid infrastructure is already constrained.
2.5 Dedicated AI Data Centers
The newest and most consequential addition to the facility taxonomy is the dedicated AI data center: a facility purpose-built for the computational intensity of AI training and inference workloads, equipped with specialized GPU clusters, advanced liquid cooling infrastructure, and power delivery systems capable of supporting rack densities that would be physically impossible in a conventional facility. Approximately 604 dedicated AI data centers were operating globally in 2024; that number is projected to roughly double to 1,204 by 2030. These facilities are not merely larger versions of conventional data centers — they represent a qualitatively different category of grid load, one whose power density, constancy, and infrastructure requirements have no direct precedent in utility planning history.
74% Share of all U.S. servers now in colocation or hyperscale facilities (2023) | 604 Dedicated AI data centers operating globally in 2024 | 1,204 Dedicated AI data centers projected globally by 2030 | <1.2 Power Usage Effectiveness achieved by leading hyperscale operators — vs. 1.5–1.8 at typical enterprise facilities
Section 3: Workload Categories and Their Power Consumption
The facility taxonomy described above is the container; workload categories are the content. A single hyperscale campus may simultaneously host cloud computing workloads for enterprise customers, AI inference operations serving consumer applications, and cold storage archives for media companies. The boundaries between facility type and workload type are not rigid, and that complexity is one reason that granular workload-level power consumption data is difficult to find and should be interpreted carefully. The most authoritative current breakdown, published by Goldman Sachs Research based on modeling of the global data center market, allocates current power consumption as follows: cloud computing at 54 percent, traditional enterprise workloads at 32 percent, and AI at 14 percent. That framework provides the organizing structure for the sections that follow, with streaming and storage examined within the cloud and enterprise categories where they most naturally sit.
3.1 Cloud Computing: The Dominant Load
Cloud computing — broadly defined as the delivery of computing resources (storage, processing power, software, networking) over the internet from shared, remotely operated infrastructure — currently accounts for the largest single workload share of data center power consumption at approximately 54 percent. This category is expansive enough to require some unpacking. When a small business uses QuickBooks Online, when a hospital accesses electronic health records through a vendor platform, when an engineering firm runs simulations through a rented compute cluster, or when a consumer streams a television series — all of these activities draw on cloud infrastructure. The workloads are heterogeneous, but they share a common characteristic: the computing resources that serve them live in third-party facilities operated by cloud providers or colocation operators, not in the customer’s own building.
The three dominant hyperscale cloud providers — Amazon Web Services, Microsoft Azure, and Google Cloud — collectively account for the majority of this capacity. Amazon’s capital expenditures alone reached $85.8 billion in 2024, up 78 percent year over year. Microsoft spent $44.5 billion, Google $52.5 billion, and Meta $39.2 billion. Combined, those four companies spent more than $200 billion on data center capital expenditures in 2024, a 62 percent increase from 2023. These figures reflect both the pace of cloud adoption among enterprise customers and the scale of investment required to build AI-capable infrastructure — the two trajectories are now nearly inseparable in hyperscaler capital planning.
3.2 Traditional Enterprise: The Shrinking Incumbent
Traditional enterprise workloads — internal databases, corporate e-mail systems, ERP platforms, file servers, backup and archiving systems, and legacy business applications — currently account for approximately 32 percent of total data center power consumption. This category is defined primarily by what it is not: it is not AI, and it is not cloud-native. It represents the installed base of computing infrastructure that organizations built before cloud migration became the default architecture, and it is declining as a share of total power consumption as that migration continues.
The decline of this workload category is not a sign of technological failure — it is a sign of successful migration. Organizations that decommission on-premises server rooms and move their workloads to cloud platforms are not consuming less computing power; they are consuming it from a different, more efficient facility. The efficiency gains from this migration are real and significant: enterprise data centers typically operate at PUE ratios of 1.5 to 1.8, meaning they consume 50 to 80 percent more total electricity per unit of useful computing power than the hyperscale facilities that replace them. From a grid-impact standpoint, however, the migration concentrates load — many distributed enterprise server rooms become a single large hyperscale interconnection point, which changes the infrastructure requirements at the utility level even if total consumption is reduced.
3.3 Artificial Intelligence: The Disruptive Variable
Artificial intelligence currently accounts for approximately 14 percent of total data center power consumption — a figure that, in isolation, might seem to undercut the urgency with which AI’s energy implications are discussed. The number is not wrong, but it is incomplete without the context of trajectory and intensity. AI is the fastest-growing workload category in the data center market by a substantial margin, and its energy intensity per unit of compute is categorically higher than any preceding workload type.
The intensity differential begins at the hardware level. Traditional CPU-based servers — the workhorses of conventional cloud and enterprise computing — consume roughly 300 to 500 watts per chip. The GPUs that power AI workloads run at 700 watts for 2023-generation chips and are expected to reach 1,200 watts for 2024’s next-generation hardware. At the rack level, traditional server configurations consume 5 to 15 kilowatts. AI-optimized racks, densely packed with high-performance GPUs, require 40 to 100 or more kilowatts — a power density that demands entirely different cooling infrastructure and electrical distribution systems. The economics of AI computing do not reward modesty: a single ChatGPT query consumes approximately 1,000 times more electricity than a conventional Google search.
The AI workload category itself has an important internal division: training and inference. Training is the process by which an AI model is built — a computationally extreme operation that may run for weeks or months on thousands of GPUs simultaneously. Training a single large language model like GPT-4 consumed an estimated 50 gigawatt-hours of electricity. Inference is the ongoing process of running a trained model to respond to user queries. Inference is less intensive per operation than training, but it operates continuously and at scale. Today, inference accounts for roughly 80 to 90 percent of all AI computing activity, and it is projected to represent approximately 75 percent of total AI energy demand by 2030 as AI features are embedded into everyday consumer and enterprise applications.
AI-specific servers consumed an estimated 53 to 76 terawatt-hours in the United States in 2024. By 2028, that figure is projected to reach between 165 and 326 terawatt-hours — meaning AI alone, at the upper end of that range, could consume more electricity than the entire U.S. data center sector consumed in 2024. Industry forecasters project AI’s share of total data center power to nearly double from 14 percent today to 27 percent by 2027, even as total market power consumption grows substantially.
“Because data centers handle many types of workloads, it’s difficult to distinguish the exact share of their total electricity demand that comes from AI alone. But a typical AI-focused hyperscaler annually consumes as much electricity as 100,000 households.”
Pew Research Center, October 2025, citing International Energy Agency analysis
3.4 Streaming and Content Delivery: Hidden Inside the Cloud
Streaming media — video, audio, podcasting, live sports, gaming — is one of the most publicly legible use cases for data center infrastructure, and one of the most commonly cited when the public thinks about what data centers do. It is also, from a power accounting standpoint, one of the most difficult to isolate, because streaming workloads do not occupy a discrete facility category. Netflix runs on Amazon Web Services. YouTube and Google TV run on Google Cloud. Disney+ runs on a combination of proprietary and cloud infrastructure. Spotify’s back-end lives on Google Cloud. In every case, the electricity consumed to deliver a streaming session is counted under the hyperscale cloud provider’s total consumption — not under a separate “streaming” line item.
What can be said with confidence is that content delivery and streaming represent a meaningful but stabilizing portion of cloud workload power demand. Unlike AI, which is scaling exponentially, streaming has a relatively mature growth curve — global video streaming consumption has grown, but the efficiency of content delivery networks has improved commensurately, and streaming’s per-bit energy cost has declined substantially over the past decade. This does not mean streaming is trivial. A single high-definition video stream consumes meaningfully more energy than a voice call or a text message, and billions of simultaneous streams represent a significant baseline load on cloud infrastructure. But streaming is not the source of the step-change in power demand that utilities and grid planners are currently scrambling to accommodate. That distinction belongs to AI.
3.5 Storage: Stable, Distributed, and Underappreciated
Data storage — the archiving, retrieval, and management of digital files, databases, backups, and media assets — is the quiet workload category that rarely generates headlines but underpins everything else. Storage infrastructure consumes a relatively modest share of total data center power: approximately 5 percent of electricity consumption at the equipment level within a facility. The stability of storage’s power share reflects the fact that storage media (hard drives, solid-state drives) have grown dramatically more efficient relative to their capacity over time, even as the total volume of data being stored has expanded at extraordinary rates.
Storage workloads are distributed across all facility types. Enterprise organizations maintain on-premises storage for sensitive or latency-critical data. Cloud providers operate massive distributed storage systems — AWS S3, Google Cloud Storage, Azure Blob Storage — that serve billions of users and applications. Cold storage archives for media, legal, and scientific data live in lower-cost facilities designed for infrequent access. The power demand profile of storage is characteristically steady rather than peaky, making it a relatively predictable component of total data center load — a meaningful contrast to AI training workloads, whose demand can surge to full capacity for sustained periods before dropping sharply between jobs.
54% Current data center power share: Cloud computing (incl. streaming and SaaS) | 32% Current data center power share: Traditional enterprise workloads (incl. storage, e-mail, legacy apps) | 14% Current data center power share: Artificial intelligence | ~5% Storage equipment’s share of power consumption within a typical data center facility
Section 4: The AI Inflection — Why the Mix Is Shifting and What It Means for the Grid
The projection that AI will grow from 14 percent to 27 percent of total data center power consumption by 2027 is not, on its face, a dramatic shift. But it obscures the speed and scale of what that transition actually requires. Total data center power demand is itself growing — the market is not a fixed pie being resliced. Goldman Sachs Research projects total global data center power demand growing from approximately 55 gigawatts today to 84 gigawatts by 2027. AI’s share expanding from 14 to 27 percent of a market that is simultaneously growing by more than 50 percent means AI’s absolute power demand nearly quadruples in three years. That is the number that utility planners, transmission engineers, and land use regulators need to hold in mind.
The implications for grid infrastructure are not incremental. AI data centers impose a qualitatively different demand profile than the workloads that preceded them. Cloud computing workloads are variable — they ramp up during peak usage periods and draw down during off-hours. Traditional enterprise workloads follow business-day patterns that utilities have accommodated for decades. AI training workloads are different: they run at or near full capacity continuously for extended periods, creating an effectively flat, maximum-draw load profile that utilities have rarely had to plan for at this scale. The IEA projects that electricity consumption from accelerated computing servers — the hardware class that drives AI workloads — will grow at 30 percent annually through 2030, compared to 9 percent annual growth for conventional servers. Accelerated servers alone account for nearly half of the projected net increase in global data center electricity consumption through the end of the decade.
For municipalities and land developers, this distinction carries direct practical consequences. A proposed data center described as a “cloud facility” and a proposed data center described as an “AI training campus” may look similar from the road — both are large, low-profile industrial buildings — but their power demand profiles, cooling infrastructure requirements, water consumption, and grid connection specifications are substantially different. A 500-megawatt AI training facility draws that power continuously. A 500-megawatt cloud facility may average 60 to 70 percent of that level across a 24-hour period. The difference matters for substation sizing, for transmission line capacity, and for the infrastructure cost allocation questions that have become so contentious in utility rate cases.
Section 5: Power Consumption Inside a Data Center — Where the Electricity Actually Goes
Understanding which workloads consume the most power is one dimension of the analysis. Understanding where electricity goes once it enters a data center facility is a separate but equally important question — one that explains why the energy intensity of AI facilities is so much higher than the workload share alone would suggest, and why cooling infrastructure has become one of the most consequential design variables in contemporary data center development.
Within a typical data center, computing servers account for approximately 40 to 50 percent of total electricity consumption. Cooling systems — the infrastructure that prevents servers from overheating — account for another 38 to 40 percent. Network and data storage equipment together consume roughly 10 percent. Lighting, power conditioning, uninterruptible power supplies, and other facility infrastructure account for the remainder. These ratios hold reasonably well for conventional facilities, but they shift significantly for AI-optimized data centers, where the extraordinary heat generated by densely packed GPU racks demands more aggressive and energy-intensive cooling solutions.
The cooling challenge is the engineering frontier of the AI data center era. Conventional air cooling — circulating chilled air through server aisles — is reaching its physical limits at the power densities that GPU clusters require. Facilities designed for 40 to 100 kilowatts per rack are increasingly deploying liquid cooling systems that pump coolant directly through server chassis, extracting heat far more efficiently than air can. Some facilities are experimenting with immersion cooling, in which servers are submerged in non-conductive liquid. These approaches reduce the energy penalty of cooling relative to computing, but they introduce new infrastructure requirements — including, in some configurations, substantially higher water consumption — that community and environmental review processes are only beginning to account for.
The Power Usage Effectiveness metric — the ratio of total facility power consumption to useful IT power consumption — provides a useful summary of cooling and infrastructure overhead. A PUE of 1.0 would mean every watt entering the building goes directly to computing. A PUE of 2.0 means the facility consumes twice as much total power as its servers actually use. The industry average PUE has improved from 2.5 in 2007 to approximately 1.58 in 2023, driven primarily by the efficiency innovations of hyperscale operators. But that improvement has plateaued in recent years as AI workloads push thermal management requirements beyond the range that conventional efficiency gains can address.
~40–50% Share of data center electricity consumed by computing servers | ~38–40% Share consumed by cooling systems | 1.58 Average U.S. data center Power Usage Effectiveness in 2023 — down from 2.5 in 2007 | 100+ kW Per-rack power draw at cutting-edge AI training facilities — vs. 5–15 kW at conventional facilities
Why This Matters
▸ For the General Public: Every time you use a cloud service, stream a video, send a file, or interact with an AI assistant, you are drawing on data center infrastructure that consumes electricity at industrial scale. Understanding how that consumption breaks down — and recognizing that AI demands dramatically more power per task than anything that came before it — is the foundation for understanding why electricity bills are rising, why new transmission lines are being proposed through communities that never agreed to host them, and why the politics of data center development have become so contentious. The workload inside a data center is not an abstraction. It is a direct determinant of the infrastructure burden being placed on the grid that powers your home.
▸ For Government & Policymakers: The workload composition of proposed data centers is a policy variable that current regulatory frameworks largely ignore. Zoning ordinances, utility interconnection agreements, and rate case proceedings treat data centers as a category, when the relevant distinctions — between a cloud colocation facility averaging 60 percent capacity and an AI training campus running at full draw continuously — have fundamentally different implications for infrastructure cost, grid reliability, and ratepayer impact. Regulators and planners who want to right-size their oversight frameworks need workload-level disclosure requirements, not just facility-level approval processes. The legislative window for establishing those requirements is open now, before the next generation of AI campuses arrives at planning department desks already entitled.
▸ For Customers & Investors: The shift in data center workload composition is the single most consequential trend in power infrastructure planning for the remainder of the decade. Land parcels and grid interconnection agreements structured for conventional cloud or enterprise data center demand profiles may prove inadequate — or inadequately priced — for AI-optimized tenants seeking 500-megawatt-plus connections with flat, continuous load profiles. Conversely, sites that have been underwritten with AI-grade power delivery specifications will carry a significant premium in a market where suitable powered land is already scarce. The capacity and cost terms associated with a given parcel’s grid connection are not peripheral concerns — they are the central variable in project economics for the fastest-growing segment of the data center market.
Key Takeaways
The U.S. data center market consumed 183 terawatt-hours of electricity in 2024, representing more than 4 percent of total U.S. power generation. That consumption flows through more than 5,000 facilities spanning a wide spectrum of types — from corporate server rooms to campus-scale hyperscale complexes to purpose-built AI training clusters. The market has undergone a structural consolidation: 74 percent of all servers now operate in colocation or hyperscale facilities, a near-complete reversal of the enterprise-dominated market of a decade ago.
By workload, cloud computing currently accounts for approximately 54 percent of total data center power consumption, traditional enterprise workloads for 32 percent, and artificial intelligence for 14 percent. Streaming and content delivery are embedded within the cloud category and do not constitute a discrete facility or power accounting segment. Storage, while foundational, consumes approximately 5 percent of in-facility electricity at the equipment level and has a stable, predictable load profile that makes it a relatively benign component of grid planning relative to AI.
AI’s current share of 14 percent understates its trajectory and its intensity. By 2027, AI is projected to account for 27 percent of a total market that will itself be roughly 50 percent larger than it is today — meaning AI’s absolute power demand is on course to nearly quadruple in three years. The hardware AI requires consumes 6 to 10 times more electricity per rack than conventional cloud infrastructure, and its load profile — continuous, maximum-draw — is categorically different from the variable demand patterns that utility planning has historically accommodated. Inference, not training, is already the dominant AI workload by volume, and as AI features embed into everyday consumer products, inference demand will scale with adoption in ways that are difficult to model and harder still to plan for.
The practical consequence for land developers, utilities, municipalities, and investors is that the workload behind a data center proposal is not a technical footnote — it is the central fact that determines the facility’s infrastructure requirements, its grid impact, and its long-term value. Powered land with grid connections sized and priced for AI-grade demand will carry a significant premium in a market where such sites are already scarce and becoming more so.
Sources
- Pew Research Center — “What we know about energy use at U.S. data centers amid the AI boom”
- Goldman Sachs Research — “AI to drive 165% increase in data center power demand by 2030”
- U.S. Department of Energy / Lawrence Berkeley National Laboratory — “2024 Report on U.S. Data Center Energy Use”
- International Energy Agency — “Energy demand from AI”
- Belfer Center for Science and International Affairs, Harvard Kennedy School — “AI, Data Centers, and the U.S. Electric Grid: A Watershed Moment”
- Congressional Research Service — “Data Centers and Their Energy Consumption: Frequently Asked Questions”
- AI Multiple — “AI Energy Consumption Statistics”
- Deloitte — “As generative AI asks for more power, data centers seek more reliable, cleaner energy solutions”
- World Resources Institute — “Powering the U.S. Data Center Boom: The Challenge of Forecasting Electricity Needs”
- IAEI Magazine — “How Much Electricity Does a Data Center Use? Complete 2025 Analysis”
- ABI Research — “Data Center Energy Consumption Forecast, 2024–2030”
- /dev/sustainability — “Data center energy and AI in 2025”
Ready to Move?
Whether you're a developer evaluating sites, a landowner with acreage, or a community leader with questions — we respond within one business day.